TexSlide supports generating graphics using LaTeX code, rendered in SVG vector graphic format. The graphics can be resized and will maintain sharp clarity at any zoom level.
Syntax Example
\begin{tikzpicture}
\begin{axis}[axis lines=none,ymin=0,ymax=1.15,xmin=-5,xmax=6,domain=-5:6,samples=250,no markers,clip=false]
\path[name path=xaxis] (axis cs:\pgfkeysvalueof{/pgfplots/xmin},0) -- (axis cs:\pgfkeysvalueof{/pgfplots/xmax},0);
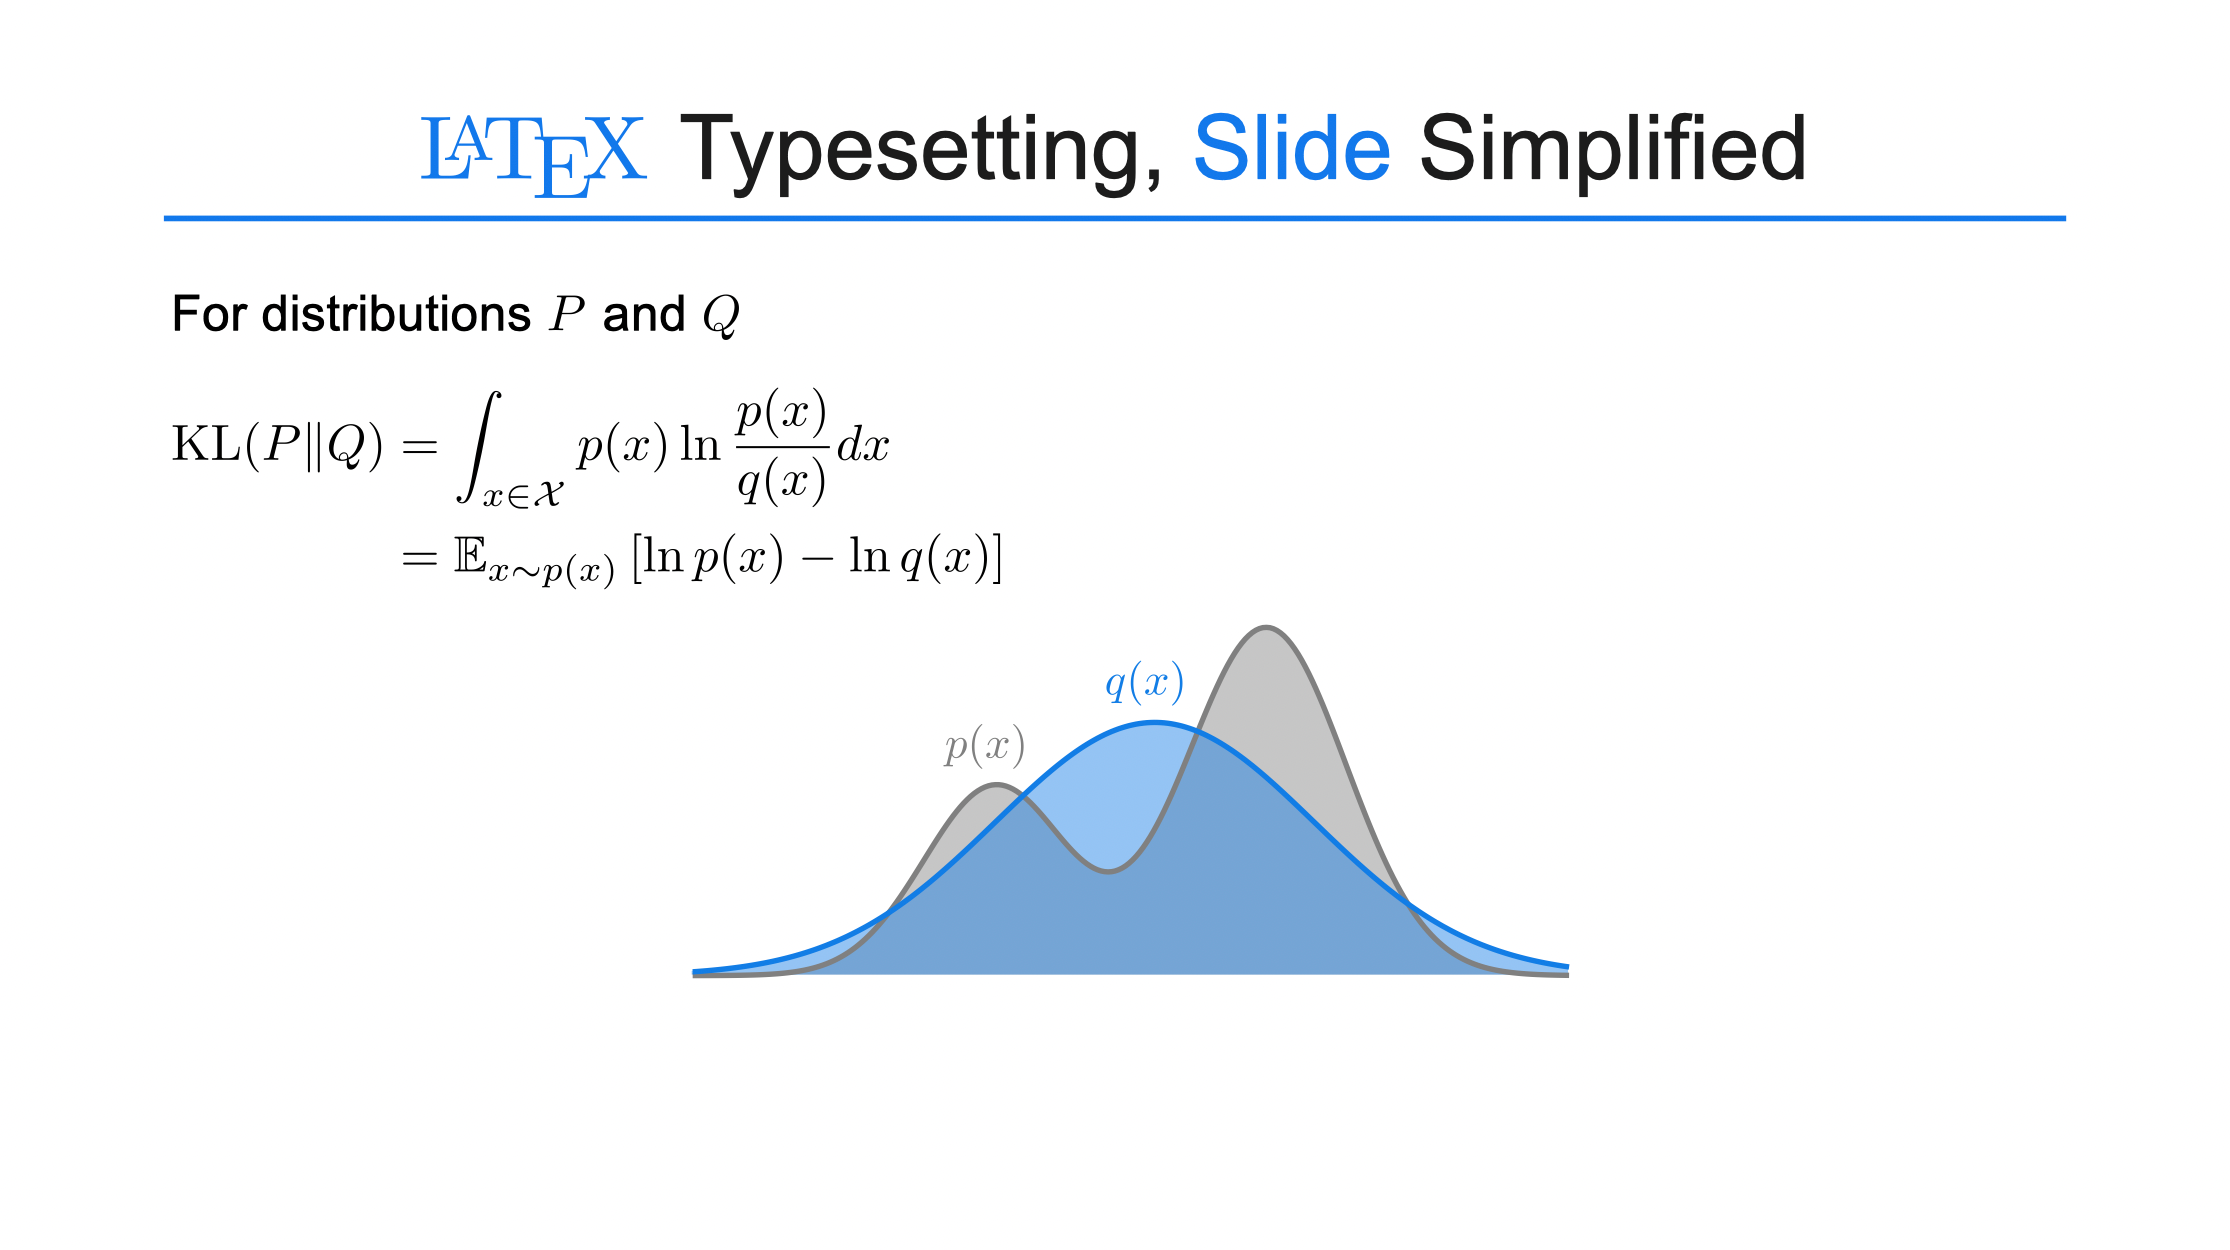
\addplot[name path=gray_line, draw=gray, line width=1.2pt, fill=none]
{(0.3 * exp(-(x-(-1.2))^2 / (2*0.9^2))) + (0.55 * exp(-(x-2.2)^2 / (2*1.0^2)))};
\addplot[fill=gray, fill opacity=0.45, draw=none]
fill between[of=gray_line and xaxis];
\node[color=gray, anchor=south] at (axis cs:-1.3, 0.3) {$p(x)$};
\addplot[name path=blue_line, draw=myBlue, line width=1.2pt, fill=none]
{0.4 * exp(-(x-0.8)^2 / (2*2.0^2))};
\addplot[fill=myBlue, fill opacity=0.45, draw=none]
fill between [of=blue_line and xaxis];
\node[color=myBlue, anchor=south] at (axis cs:0.7, 0.4) {$q(x)$};
\end{axis}
\end{tikzpicture}Rendered Result